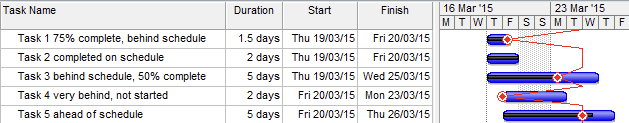
Part of providing a visual update on Gantt charts is to display the progress of completion visually. Is there a way to show this? I am finding that the Gantt can be used to plan and schedule tasks quite effectively, but lacks the visual presentation of the progress tracking that “normal” project management tools have.
Voting for it helps us understand how many users are looking for such a feature/option/improvement and helps us prioritize what to develop/work on next.

 icon!
icon!